Posted by : Unknown
Jumaat, 3 Jun 2016
Introduction
to Statistical Data.
The study of data: how to collect, summarize and
present it.
How
to collect data:
Descriptive (like "high" or
"fast") or Numerical (numbers).
Numerical Data can be Discrete
or Continuous:
Discrete
data is counted,
Continuous data is measured(within a range)
Continuous data is measured(within a range)
Survey:
- Step one: Create
the questions
- Step two: Ask
the questions
- Step three: Tally
the results
- Step four: present the results
How
to Show Data
Pie Charts, the angles formed by each part adds up to
360o
Dot Plots, A graphical display of data using dots.
Line Graphs, a graph that shows information that is connected in some way (such as change over time)
Scatter (x,y) Plots,has points that show the relationship between two sets of data.
Pictographs
Histograms, it is a vertical bar graph with no
gaps between the bars. The area of each bar is proportional to the frequency it
represents.
Frequency Distribution, The organization of raw
data in table form with classes and frequencies.
Stem and Leaf Plots, a diagram that summarises while maintaining the individual data point. The stem is a column of the unique elements of data after removing the last digit. The final digits (leaves) of each column are then placed in a row next to the appropriate column and sorted in numerical order.
Cumulative Tables and Graphs, a plot of the cumulative frequency against the upper class boundary with the points joined by line segments
Question:
1. The table shown no.of kids of technician
in Fade Company.Make a scatter plot by the given data below.
Ans/Solution (Q.1) :
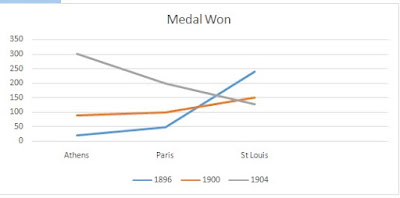
2. Construct a bar graph from the data of medal won
every given years below.
Olympic site
|
1896
|
1900
|
1904
|
Athens
|
20
|
90
|
301
|
Paris
|
47
|
100
|
|
St.Louis
|
239
|
150
|
128
|


